Process Gas Chromatographs (Process GC’s) are purpose-built gas monitors which provide specific data, both qualitative (species) and quantitative (amount), regarding the composition of a gas stream or sample found in an industrial or atmospheric application.
Process GC’s, unlike laboratory-based GC’s, are typically configured and used for static applications where the operator requires frequent information about a specific set of target compounds over long periods of time. Process GC’s are primarily designed to run as stand-alone, low maintenance gas analyzers and typically don’t require chemical or technical backgrounds to operate.
Process GC’s also typically contain digital and analog inputs and outputs which allow them to interface with external triggers, data collection systems and other on-site controls.
Process GC’s find applications in many industries such as: Oil and Gas Exploration, Outdoor Air Quality Monitoring, Fugitive Emission detection and monitoring and Specialty Gas supply.
“Gas Chromatography” Big Phrase, Simple Concept
The basic elements of Gas Chromatography are quite simple and together, make a powerful tool to specifically analyze one or more gases. There are 4 steps to a chromatographic analysis: sample collection, sample injection, sample separation, and sample detection.
A gas sample is collected and then it is introduced into an inert gas stream called a carrier gas. The carrier gas moves (carries) the gas sample through a column or series of columns where the gases in the sample are physically separated. Once the gases of interest have been separated by the column, they are directed to a detector which provides an output proportional to their concentration. A GC analysis can be a manual procedure or an automated online process.

Sample Collection – Samples are prepared for analysis with a number of different methods. Fixed sample loops are the method of choice for automated process analysis (Image 1). Other common techniques range from simply collecting a gas sample in a gas syringe, to much more complex methods such as volatilizing a liquid into a gas, pre-concentrating onto a collection media, or cryogenically condensing a gas sample.
Sample Injection – A sample can be manually injected into the carrier gas with a syringe, but is typically introduced via a sample loop and analytical valve which are in-line with the carrier stream. Typical carrier gases include nitrogen, helium, argon and, in some instances, hydrogen or air. Generally, the better the quality of the carrier gas the better the analytical results. In automated instruments, the carrier gas is switched in line with the sample loop for a precise, pre-determined period of time, injecting the sample onto the column (Image 2). This cycle is typically repeated continuously in process GC analysis.
Sample Separation – The heart of the GC, the columns are the tool which separates the sample into its constituent components. Columns are mounted in an oven with precise temperature and carrier gas flow control. Under these tightly controlled conditions, the analysis can be repeated; the same gas component will exit the column (elute) with the same timing as the previous analysis.
As an example, one of the most common columns, utilizing a molecular sieve phase or packing material, separates sample based on the size of the individual molecules it contains. When a sample consisting of Hydrogen, Oxygen, and Nitrogen is passed through this column, the small size of the Hydrogen molecules allows them to make their way through the phase very quickly compared to the Oxygen and Nitrogen (Image 3). The Nitrogen molecules, being the largest, take the longest to make their way through the phase. On a macro scale, this could be compared to using various screens to remove fine sand and large stones from a load of mixed gravel.
Different phases which separate gasses based on boiling point, polarity, molecular weight and molecular size are readily available in the market. Add different phase densities, tube bores and column lengths to the broad variety of phases and a virtually infinite selection of columns options becomes available.
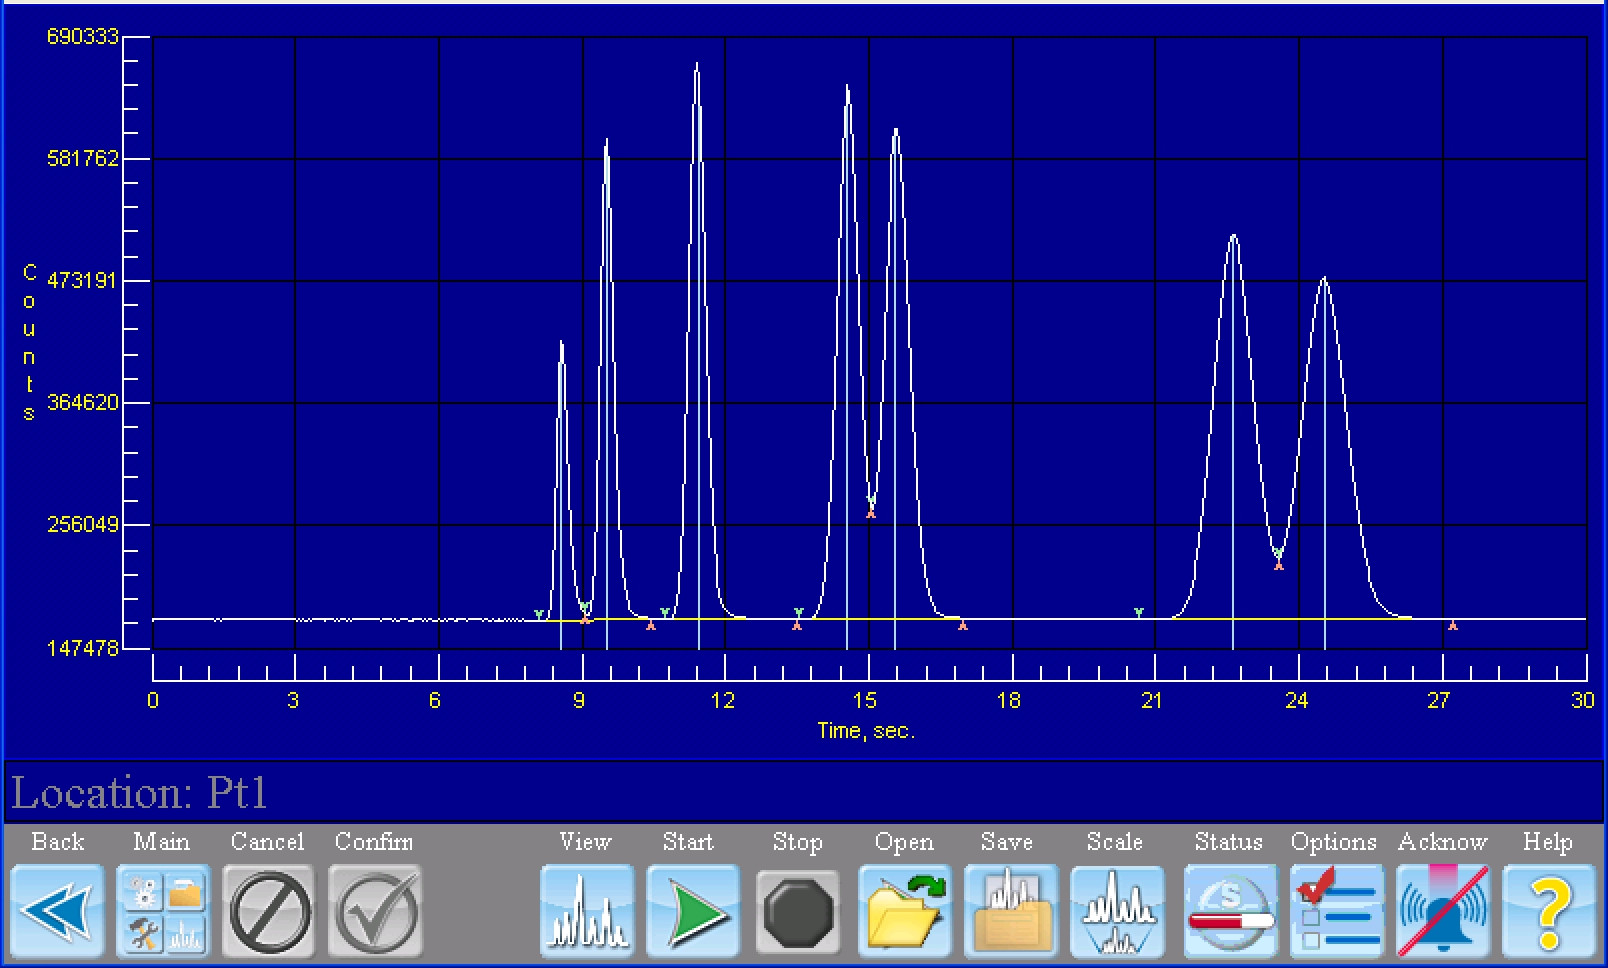
Sample Detection – Once the separated gasses leave (or elute from) the column(s), they pass through a detector which, in turn, responds with an output signal. This signal is what generates the characteristic GC peaks in a chromatogram (Image 4). The peaks are proportional in area to the concentration of the gases of interest. Peak size previously was difficult to quantify, but powerful integration software has turned this into an easy task. GC software and hardware can also incorporate a wide variety of diagnostic, reporting, and output capabilities. GC’s are designed with various detectors based on the analytical requirements; gas composition and required detection limits help determine the detector used. Flame Ionization Detectors (FID) are used for most hydrocarbons, Photoionization Detectors (PID) for volatile organics and Thermal Conductivity Detector (TCD) for general use and other specialty detectors are available. Process GC’s typically utilize FID, PID, or TCD, due to their simple reliable designs.